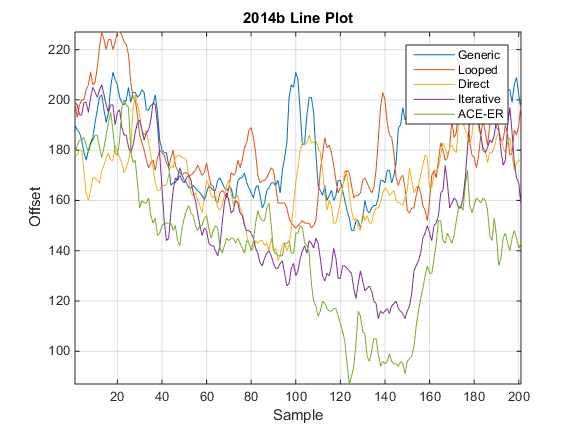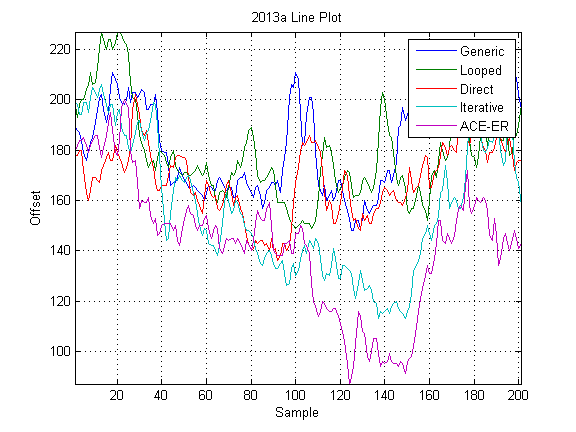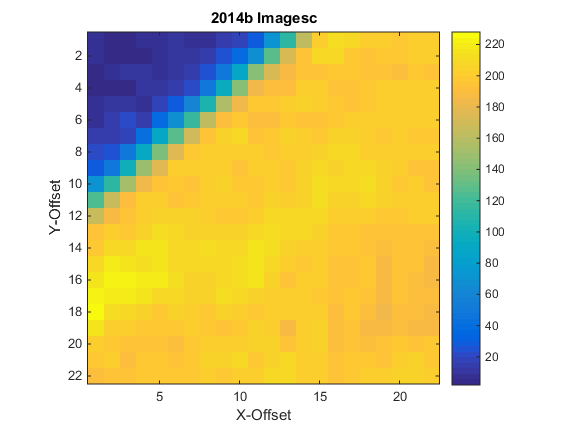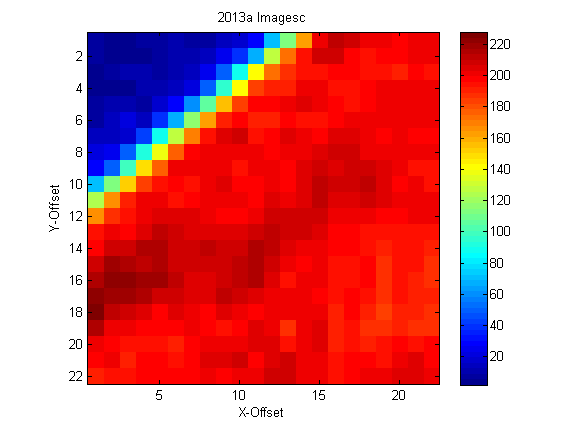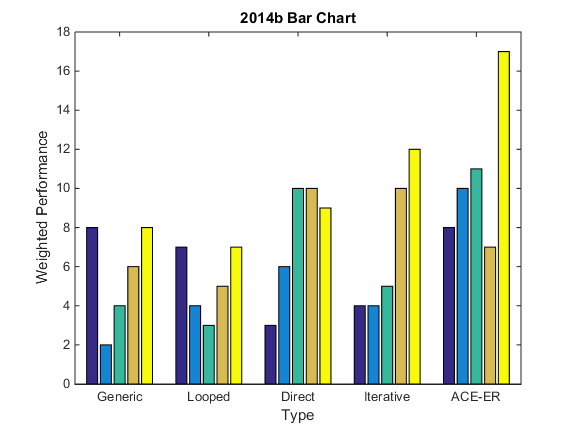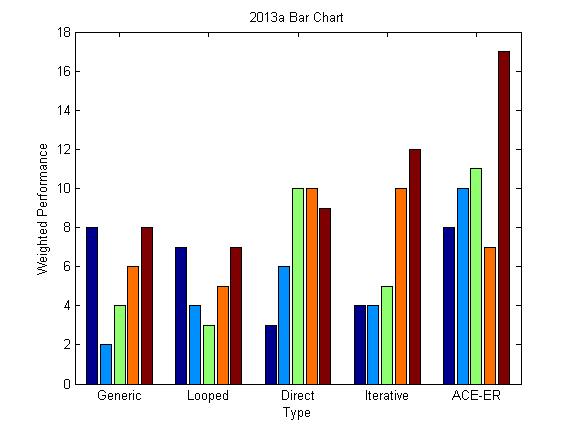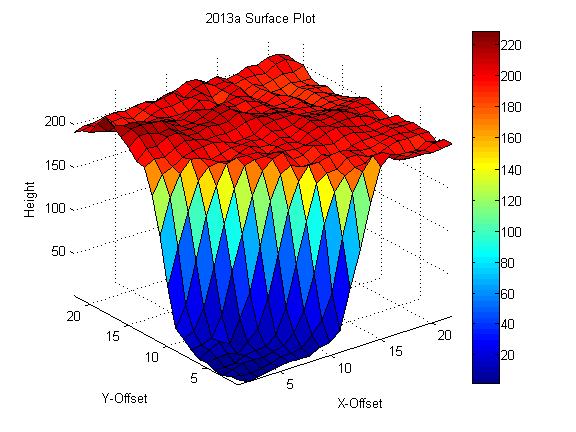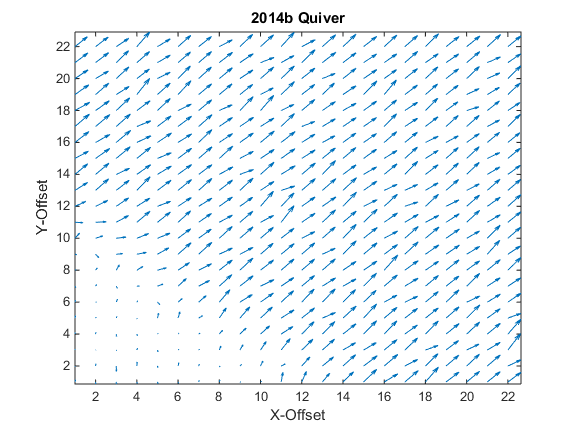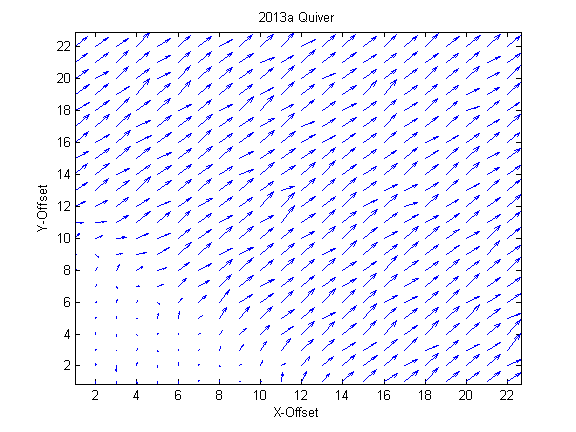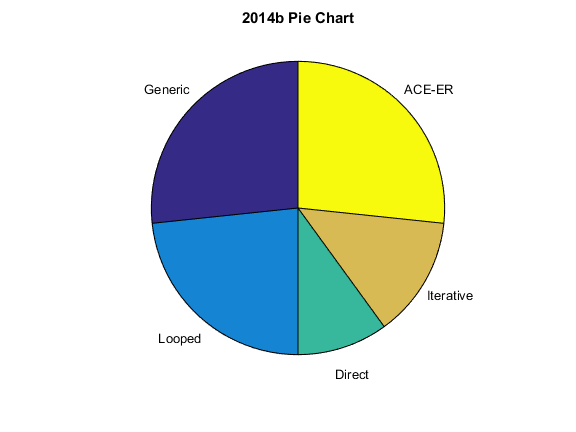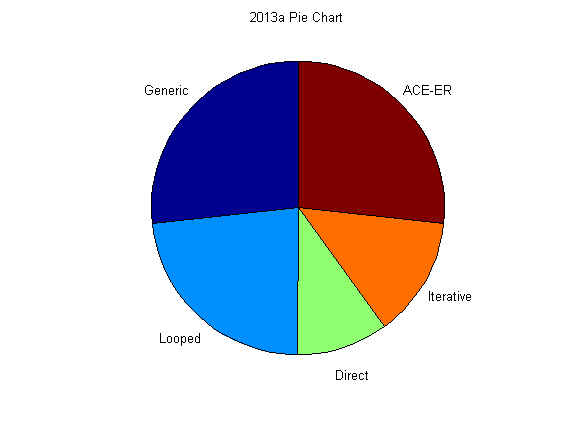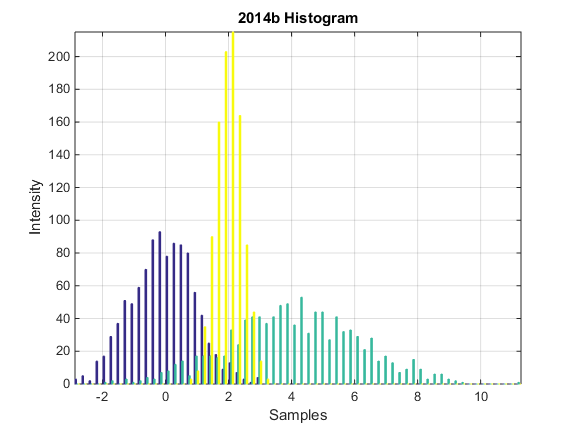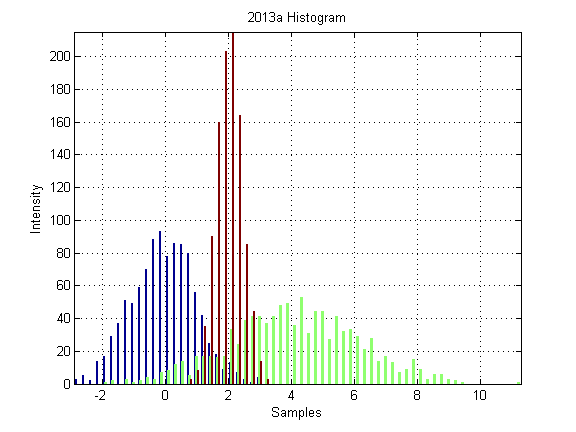
Mathworks MATLAB R2014b introduced a new graphical system. The charts below compare the old plots in R2013a with the new R2014b plots sporting
- New Color Scheme
- Anti-Aliasing on the lines and fonts
- Aesthetically pleasing grid
- Default Font size and weight on title, axes labels, and ticklabels
Overall, this is a substantial improvement over the old graphical system; the new figures are tasteful and modern.