The Z-Order (Morton) Curve describes an ordering a 2-D image in memory so that points in the image that are close in Euclidean distance are similarly close in memory. It can be compared to column-major ordering where pixels are simply lined up according to columns. This makes indexing easy but breaks all locality and can make linear transformations appear overly complex.
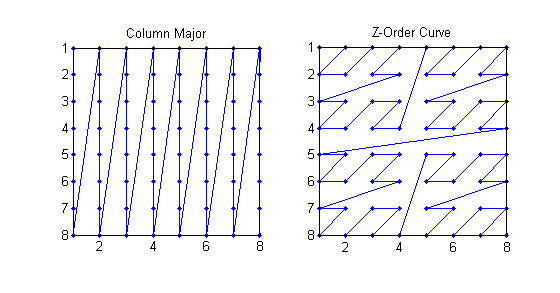 I wanted to visualize how this ordering changes locality be visualizing the wavelet transform that has been similarly modified to account for an image being placed in memory with the z-order curve. By placing each 2D wavelet as a row in the matrix and then displaying it as an image we get the following:
First, the Haar wavelets for an 8×8 image:
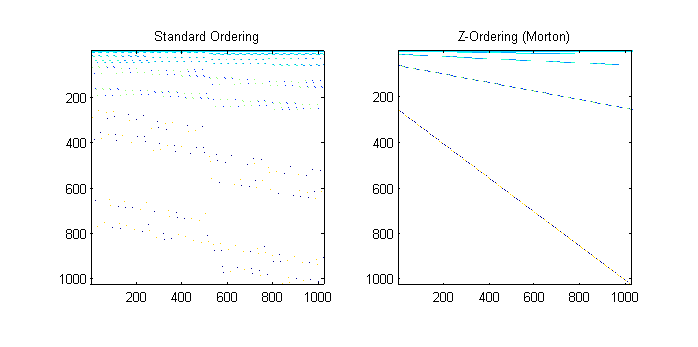
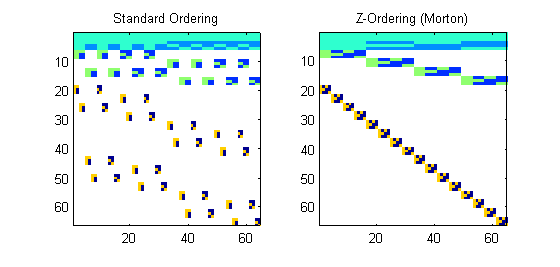 Notice how the column major ordered wavelets have large breaks that scatter the pieces of each wavelet across memory. However, the properly z-ordered image results in a stacked, block diagonal transform. Note that special care has to be taken since the wavelets are stored in levels and for the Wxx Wxy and Wyy. We stack the wavelets in an order from the largest level to smallest. Then, for each level, we group together wavelets for each pixel so that the result is the strong block diagonal patterns. For example, the row order for the matrix may be as show here:
 Where we start in the top left and then for each levels quadrant we move in the z-order curve for that quadrant.
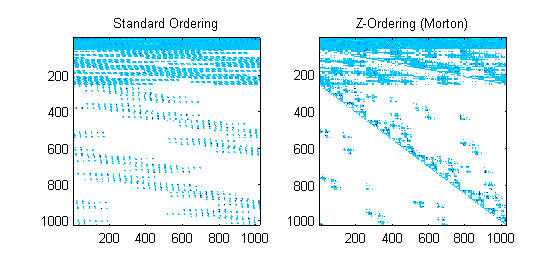
Large matrices result in more fragmented memory for column major order, while the z-ordering preserves the diagonal pattern.
 For Daub8 wavelets the picture is not as clean because the nonzero terms do not fall on example powers of two, but there is still strong structure and the non-zero terms are concentrated:
 The code used to create the ordering is by Ravi Lakkundi from Mathworks File Exchange (BSD License) and is:
function A = mapping(n)
% To create a Morton Scan order matrix
if n == 2
A = [1 2; 3 4];
else
B = mapping(n/2);
A = [B B+(n/2)^2; B+(n/2)^2*2 B+(n/2)^2*3];
end